Construction Site Analytics – Real-Time Data Across All Your Projects
Hustro gives construction managers real-time visibility into defect trends, inspection results, H&S performance and contractor productivity — across all active sites in one dashboard. No manual reporting, no Excel pivot tables, no waiting until end of week.

What do construction managers
struggle with?
NO CURRENT DATA
"I don't know what's actually happening on site right now"
Reviewing key indicators requires manually collecting data from site managers, WhatsApp groups and Excel files. By the time the report is ready, the data is already outdated — and decisions are made on yesterday's information.
REACTIVE NOT PREVENTIVE
"We find out about problems only after they've already cost us money"
Without trend data, managers react to problems after they occur instead of spotting patterns early. A subcontractor missing deadlines three weeks in a row is obvious in hindsight — invisible without the data.
DATA SCATTERED EVERYWHERE
"Our data is in five different places and none of them talk to each other"
Defects in one spreadsheet, inspection results in another, H&S reports in email. Manual updates, duplicate entries and no single source of truth mean managers spend hours consolidating data instead of acting on it.
Why is analytics needed on the construction site?
-
01Overview
Quick situation overview
The dashboard presents data from three processes — quality, health & safety and environment - in one place. No more clicking through files or waiting for weekly reports. The current state of every site is visible at a glance, at any time. -
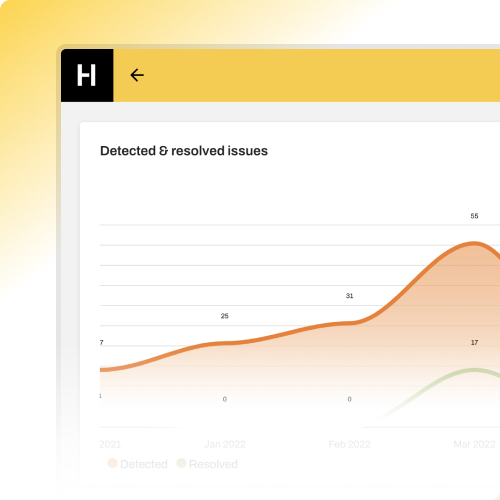
02Charts
Ready-made charts and metrics
Number of defects, resolution times, delays, H&S observations and their impact on work - all presented as ready-made charts without any manual data processing. Spot trends before they become problems. -
03Filters
Filters and context
Select date range, process type and location - see exactly what's relevant to you. Filter by contractor, site, building or team. Every chart responds instantly, giving you the context you need to make the right decision. -
04Collaboration
Common tool for the whole team
Construction manager, project manager, safety officer, construction director - everyone sees the same data in real time. No more different versions of the truth from different spreadsheets. One system, one source of truth, for the whole team.
Companies that save time on reporting with Hustro

6,500 hours saved in the H&S department

Less time on reporting — more time on site

Report preparation time reduced by over 70%
Three Processes – One System

Quality Management
Manage the quality system, control production processes, and ensure compliance with norms and standards.
Explore the Quality module
Health & Safety Management
Monitor workplace safety, manage occupational risks, and maintain documentation in compliance with regulations.
Discover the H&S module
Environmental Management
Control environmental impact, manage waste, and comply with environmental protection requirements.
Environmental Management