
Hustro - CDE Platform - Zgodny ze Standardem

Construction Site Analytics – Real-Time Data Across All Your Projects

Hustro gives construction managers real-time visibility into defect trends, inspection results, H&S performance and contractor productivity — across all active sites in one dashboard. No manual reporting, no Excel pivot tables, no waiting until end of week.

Real-time dashboards Automatic PDF & XLS reports All sites in one view
Construction site analytics and reporting – Hustro
Problemy z dokumentacją w budownictwie
Challenges

What do construction managers
struggle with?

NO CURRENT DATA

"I don't know what's actually happening on site right now"

Reviewing key indicators requires manually collecting data from site managers, WhatsApp groups and Excel files. By the time the report is ready, the data is already outdated — and decisions are made on yesterday's information.

REACTIVE NOT PREVENTIVE

"We find out about problems only after they've already cost us money"

Without trend data, managers react to problems after they occur instead of spotting patterns early. A subcontractor missing deadlines three weeks in a row is obvious in hindsight — invisible without the data.

DATA SCATTERED EVERYWHERE

"Our data is in five different places and none of them talk to each other"

Defects in one spreadsheet, inspection results in another, H&S reports in email. Manual updates, duplicate entries and no single source of truth mean managers spend hours consolidating data instead of acting on it.

Zastosowanie — Inspekcje i odbiory
Benefits

Why is analytics needed on the construction site?

  • 01
    Overview

    Quick situation overview

    expand_more
    The dashboard presents data from three processes — quality, health & safety and environment - in one place. No more clicking through files or waiting for weekly reports. The current state of every site is visible at a glance, at any time.
  • 02
    Charts

    Ready-made charts and metrics

    expand_more
    Number of defects, resolution times, delays, H&S observations and their impact on work - all presented as ready-made charts without any manual data processing. Spot trends before they become problems.
  • 03
    Filters

    Filters and context

    expand_more
    Select date range, process type and location - see exactly what's relevant to you. Filter by contractor, site, building or team. Every chart responds instantly, giving you the context you need to make the right decision.
  • 04
    Collaboration

    Common tool for the whole team

    expand_more
    Construction manager, project manager, safety officer, construction director - everyone sees the same data in real time. No more different versions of the truth from different spreadsheets. One system, one source of truth, for the whole team.
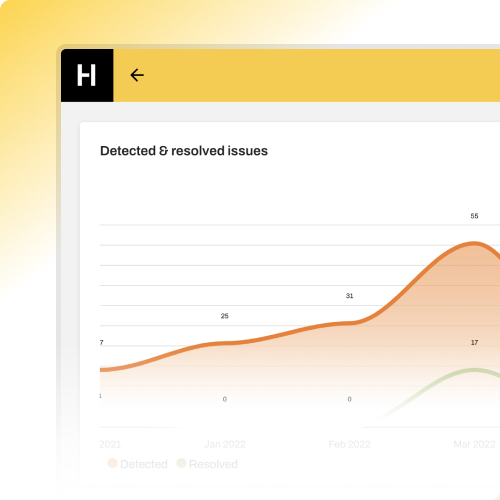
Construction site analytics – Hustro
Referencje — Zarządzanie usterkami
Case studies

Companies that save time on reporting with Hustro

Doraco

6,500 hours saved in the H&S department
Since implementing Hustro, we've seen a significant improvement in our ability to manage safety protocols across all our construction sites. Automatic report generation eliminated thousands of hours of manual desk work - hours that our H&S team now spends on actual site supervision instead of paperwork.
Kajetan Kwiatkowski
Senior H&S Specialist – Doraco
Read the full story
Gulermak

Less time on reporting — more time on site

In large infrastructure projects, quick detection and elimination of hazards is critical. I now spend significantly less time on reporting - many documents are generated automatically. The registration and communication process is fast and efficient, and Hustro makes that possible.
Magda Piechocka
H&S Manager – Gulermak Polska
Read the full story
InstalOne

Report preparation time reduced by over 70%

We work for the largest and most demanding investors, which is why efficient reporting is crucial. Thanks to Hustro, we reduced report preparation time by over 70% and significantly improved work coordination - the platform allows quick issue identification, task assignment and progress monitoring.
Artur Bielawski
Contract Manager – InstalOne
Read the full story
Nagłówek Sekcji - Do Lewej
SUPPORTED PROCESSES

Three Processes – One System

Nagłówek Sekcji - Do Lewej
METRICS AND CHARTS

Data that will change your work

Analysis of detected reports

See the dynamics of problems and progress in solving them.

  • 📊 Real-time trend monitoring
  • ⚡ Quick identification of problematic areas
  • 🎯 Optimization of report resolution process

Timeliness control

Monitor whether repairs are performed on time.

  • ⏰ Tracking task completion times
  • 🚀 Improving team efficiency
  • 📈 Predicting future delays

Analysis of problem sources

Identify the most common sources of problems and threats.

  • 🔍 Identification of main failure causes
  • 🛠️ Proactive preventive actions
  • 💡 Optimization of maintenance processes

Safety

Analysis of report impact on safety

  • 🛡️ Real-time safety threat monitoring
  • 📋 Compliance with regulations and standards

Find the biggest pain points, track progress and prepare reports. Effortlessly and within seconds!

Nagłówek Sekcji - Do Lewej
Related modules

Analytics works best with these modules

Start from the basics and take a deep dive into real-time construction data.

Construction site analytics dashboard

The analytics module collects data automatically from defect registrations, inspections and H&S observations across all your construction sites. All information is displayed as simple bar, line and area charts – no manual data entry, no pivot tables, no waiting for weekly reports.

Filter by site, contractor and date range

Every chart is fully adjustable – select the date range, process type (quality, H&S, environment), organisation and site. Bar, line and area charts let you control exactly what data you see and over what interval. Day, week, month or custom range.

Export construction reports in SVG, PNG and CSV

All charts in the analytics module can be downloaded in SVG, PNG and CSV formats – making it easy to include data in management reports, board presentations or investor updates without any additional desk work.

Integrate construction data with your BI and ERP systems

Both analysed and raw data from Hustro can be integrated with your existing systems via API – BI tools, ERP platforms, property management software or custom dashboards. One source of truth, connected to your entire tech stack.

FAQ — Zarządzanie zadaniami
FAQ

Frequently asked questions

What is construction site analytics software?

Construction site analytics software collects data from defect registrations, inspections and H&S observations across all active sites and presents it as real-time dashboards and automated reports. It replaces manual data collection from Excel files, WhatsApp groups and weekly site manager calls — giving construction managers an accurate, current picture of every project at any time.

What data does Hustro analytics cover?

Hustro analytics covers three process areas: quality (defects, non-conformances, inspection results), health & safety (observations, incidents, H&S inspection scores) and environment (environmental observations and ESG-related data). All data is collected automatically as site teams use the app - no manual data entry required.

Can I see analytics across multiple construction sites at once?

Yes. Hustro gives managers a single dashboard showing data across all active projects simultaneously - filterable by site, contractor, building, date range and process type. Teams managing 5, 10 or 20 simultaneous projects see everything in one place without switching between systems or consolidating spreadsheets.

How are construction reports generated in Hustro?

Reports are generated automatically in PDF and XLS format with one click - including defect summaries, inspection results, H&S statistics and contractor performance data. Charts can also be exported in SVG, PNG and CSV formats for use in management reports, board presentations or investor updates. No manual formatting, no desk work after site visits.

Can Hustro analytics identify recurring problems and patterns?

Yes. Hustro tracks defect and observation trends over time - showing which contractors miss deadlines most frequently, which building zones generate the most defects and which types of issues repeat across projects. This allows managers to act preventively rather than reactively, catching patterns before they become costly problems.

Can Hustro data be integrated with BI tools and ERP systems?

Yes. Both analysed and raw data from Hustro can be integrated with external systems via API - including BI platforms such as Power BI and Tableau, ERP systems, property management software and custom dashboards. Hustro becomes a single source of construction site data connected to your existing tech stack.

How much does Hustro analytics cost?

Hustro analytics is included in all licence plans - no separate module fee. Per-user licence from €28/month (annual contract) covering all modules including analytics, defect management, inspections and H&S. Per-project licence available from €670/month for up to 100 users. Enterprise pricing available on request.
Hero z Formularzem - Hustro
Try for free

See Hustro analytics in action — book a free demo

Get real-time visibility into defects, inspections and H&S performance across all your construction sites. One dashboard, all your data, no manual reporting.

Real-time dashboards across all sites
Quality, H&S and environment data in one place - always current
Automatic PDF & XLS reports
Generated in one click - no manual data collection, no Excel pivot tables
Spot trends before they become problems
Filter by contractor, site, date range and process - see what matters
Live on your first site within 24 hours
No IT project required - our team configures everything on day one

Book a demo

Our team will get back to you within 24 hours

Roksana Sosnowicz

Roksana Sosnowicz

Digitalisation Specialist

Form - Book Demo
Improved Footer